Table Of Contents
Article written by Bob Veres in Inside Information, February 2022 (Volume 32, Number 2).

Synopsis: Is it really possible that a portfolio risk assessment tool for wealth managers could be as sophisticated as the algorithms that institutional teams are using?
Takeaways: Advisors can show prospects the difference between the risks they’re comfortable with and the risks they’re taking, and then provide an analysis that demonstrates a high degree of portfolio management sophistication.
Akhil Lodha, co-founder and CEO of a software product called StratiFi admits that he was a bit taken aback that financial planners weren’t more sophisticated regarding the risk levels in client portfolios—at least compared with the institutional teams that he was working with. But he admits that his perspective might have been skewed a bit.
“After grad school at Carnegie Mellon,” he says, “I was part of the team of really brilliant people, who had double Ph.Ds and managed billions of dollars of institutional wealth. Together,” he says, “we created the automated options market-making desk at Citigroup. We were tasked with building systems that could compete with the likes of Citadel, Susquehanna and Goldman Sachs.”
These risk-assessment algorithms were quite a bit more refined than simply looking at each ETF’s 3-year standard deviation or beta. “We were making markets on hundreds of thousands of options,” Lodha recalls, “calculating risk attribution so that we could take the kinds of risks that we could understand, and avoid the risks that we didn’t. Through that experience,” he continues, “I came in contact with financial advisors, and I became fascinated by the differences in approach to risk that existed between the institutions and even the most sophisticated wealth managers. The kind of sophistication that exists on the institutional side simply did not exist on the wealth management side of the business.”
Any tool that evaluates portfolio risk should also function as a communication tool, to help clients better understand their portfolios.
Bob Veres
Lokha believes that the risk control instruments advisors need to properly manage client portfolios are not dramatically different from the challenges he had faced
in the institutional world. “I saw that it was possible to adapt that same institutional risk analysis to the wealth management space,” he says. “The difference is that individuals have a finite investment horizon: they need to retire, and send their kids to college, and they might want to buy a second home,” he says. “Wealth managers have to manage to a variety of goals that are spread out among different clients in unpredictable ways, so you can’t slice and dice overall risk in quite the same precise way.”
Another difference is that a risk management tool for wealth managers should become not just a portfolio building instrument, but perhaps more fundamentally, a client communication tool. “I, myself, struggle to understand what my risk is in my 401(k) portfolio,” Lodha says, “because the systems that have been available to me would focus only on the gains and losses that people are experiencing. The interesting thing about risk,” he continues, “is that it is oftentimes invisible to the untrained eye, which means it is not easy to help end clients visualize the actual risks they’re taking in their investments, so they can decide whether they want to take that kind of risk or not.”
Risk tolerance
StratiFi represents Lodha’s answer to the challenge: a software tool that is relatively easy to use and yet embodies the same kind of sophistication that institutional risk management teams rely on. Behind the interface, there are daily data feeds and millions of real-time calculations on the ever-evolving correlations among assets, and shifting statistical odds on tail events that rise and fall based on shifting market valuations and other factors.

Everything starts with a client risk tolerance number, on a spectrum from 1-10. StratiFi offers its own risk tolerance assessment instrument that advisors can invite clients to take, where they inputs current age (actually birthday) and expected retirement date, a rough approximation of current income, portfolio goals (income, growth, preservation, growth & income), the investment time horizon and expected portfolio withdrawal rate in retirement. The risk tolerance-related questions are not unfamiliar: how would the client react if he or she lost a fifth of her portfolio value in a quick market downturn? Clients can choose a portfolio anywhere along a spectrum from conservative to aggressive, and all along the spectrum, the software shows the expected upside and downside returns out to two standard deviations.
Another question actually provides some educational content; it asks clients to select, along a spectrum, the amount of short-term losses they believe they could stomach, and wherever they move the slider (-20%? -30%?) they are shown how much the market would have to recover if they experienced that degree of loss, and how long it has taken, on average, for the portfolio to recover its original value. You can envision clients moving the slider to the right experimentally, and then, based on what they see, carefully shifting it back to the left again.
Finally, clients are invited to select the asset classes in their current portfolio, and with a few more questions, they are assigned a risk tolerance score ranging from 1-10.
Of course, advisors can skip StratiFi’s risk tolerance instrument and pull in a prospect’s or client’s numerical score from Morningstar’s risk tolerance instrument, Tolerisk or the Riskalyze score and simply enter them in—though they have to translate the 1-100 scores to the 1-10 scale. (52 becomes 5.2.)
The point is that, before any of the fancy institutional quant fireworks begins, each client will have, as a starting point, a risk tolerance score. As we’ll see shortly, some clients might want to have a different risk tolerance score for each of several portfolios, one designed to fund their retirement (moderate risk?), another might be set aside to serve as the down payment of a second home (low risk?), and another might be a trust set up for the kids to take over when they reach maturity.
PRISM ratings
In step two, StratiFi calculates a risk rating for a prospect’s/client’s portfolio, and also for all of the planning firm’s model portfolios, which are displayed on the dashboard. This risk rating is called PRISM, an acronym for Portfolio Risk Inspection System. Advisors would show prospects the discrepancy between the risks they are prepared to take and the risks they’re actually taking in their existing portfolios, and offer to help them close the gap. With existing clients, advisors can monitor the difference between the risk tolerance score and the PRISM rating, knowing that both of them can fluctuate over market cycles.
Let’s start by assuming that the advisor is meeting with a prospect, which means that the StratiFi engine is functioning as a prospecting tool. The advisor could pull in the client’s existing portfolio holdings, with permission, through an account aggregation engine (ByAllAccounts or Plaid), or through a CSV transfer, downloading and then uploading into StratiFi. StratiFi will then do a series of analyses that result in a PRISM score which, in many cases, will not match up with the risk tolerance score. The advisor, in an initial meeting, would suggest that the client shift to the firm’s model portfolio that most closely matches the risk tolerance score; if the client is a 5.2 (moderate risk), then the proposed portfolio might have a PRISM score of 5.4, which is much closer to 5.2 than the 7.1 PRISM score of the client’s current portfolio.
This, of course, is nothing new in the advisor marketplace; the difference is the level of sophistication that is applied to the portfolio risk assessment. To facilitate a deeper conversation, the StratiFi engine provides a window into the four different analyses that led to the PRISM score, and compares the existing with the proposed portfolio for each section of the analysis. In the first comparison tool, StratiFi collects historical and current market data feeds and show calculates how the current and model portfolios performed during past tail risk events. “The software runs each mix of investments back in time, and selects events where the market rose or fell 6%, 8%, 10% or more in a short time frame,” Lodha explains. “Then it shows, how did this portfolio behave in each of those time periods? We show both on an absolute basis and relative to a benchmark.”


Ideally, the proposed portfolio will have lower drawdowns during market downturns that the client’s current portfolio, and higher upside during sharp, intense upward market movements. In the demo I looked at, the client’s existing portfolio was a full participant in these downdrafts, while the (more diversified) model portfolio was less likely to sustain the same losses. Meanwhile, the upside returns during bull market tail events were roughly similar.
StratiFI also takes into account more general upside and downside capture, over longer time periods. If the benchmark market index was down 20% over some time period, 90% of the time the client’s existing portfolio’s performance might be (picking the number in the demo) -12%, while the recommended portfolio would be down 13%. During times when the benchmark index had risen 33%, 90% of the time the client’s existing portfolio would be up 18%, while the model portfolio would be up 23%.
Another factor in the PRISM analysis is diversification risk. “Correlations change all the time,” Lodha comments. “We look at the cross-asset-class correlations of the portfolio as a whole with different asset classes, and compute the correlations over rolling 6-month windows, getting a distribution, and then we time-weight the most recent observations.”
This sounds complicated, especially when the calculations are updated daily, but the output is actually fairly simple and intuitive.
Each portfolio shows a correlation band with, respectively, indices representing equities, volatility (the VIX index), commodities, real estate and fixed income. The bands are graphed above and below a line that represents zero correlation; Lodha says that the system looks for tight or loose bands (showing whether the correlation is stable or not) and for these bands to be as close to the zero line as possible. In the example I looked at, the portfolio was fairly tightly correlated with equities, which means that even though there were roughly 70 different investments in the portfolio, it was not well-diversified; its return would move up and down in tight concert with the S&P 500.
The third factor that goes into the PRISM calculation is concentrated stock analysis. “This is designed to highlight situations where one or two stocks have a significant weight in the portfolio,” Lodha explains. “A client may have 40-50 different securities in the portfolio, but three or four of them might be responsible for 30% of the overall risk. If you have a portfolio of ETFs and mutual funds, and all of them are invested in Apple, then this would show that you have high exposure to that one stock.”
In the demo I looked at, neither the client’s existing portfolio nor the recommended one was dangerously exposed to any small handful of securities. But some advisors, Lodha says, have done this analysis for clients who have concentrated holdings in their own company’s stock. Instead of requiring them to sell, they might user StratiFi’s portfolio-building tools (see below) to round out the portfolio in ways that mitigate the overweightings.

Finally, PRISM evaluates what Lodha calls the volatility risk rating. “Here, we’re looking at the gains and losses in every single security in the portfolio compared with the volatility in the markets, specifically looking at downside volatility,” says Lodha. “We calculate the beta against the VIX index for every single security, going back 20 years, time-weighting the more recent observations.”
You can think of this as a more sophisticated proxy for the standard deviation of the portfolio, although it actually measures how the portfolio will behave during periods of high and low volatility. But it also allows advisors to perform a risk attribution analysis; that is, to look at the proportion of the overall portfolio risk that is coming from each individual component of the portfolio, based on historical returns and each asset’s downside capture.
Finally, there are several ways to compare portfolio performance between the current and proposed portfolio. The simplest allows the advisor to graph returns for the existing and proposed portfolios for any time period, also showing the Sharpe ratio, maximum drawdown and time to recover, and a mountain chart that illustrates the long-term return of both portfolios and a benchmark index.
Out of the box, StratiFi compares existing and proposed portfolios during four well-known market events: the global financial crisis and the 2020 pandemic downturn on the downside, and 2013 and 2019 on the upside.
And for clients who are close to retirement, StratiFi maps out two retirement distribution scenarios, one worst-case and one best-case. The advisor and client select a distribution amount—say, 5% of the current portfolio, increased by the inflation rate. Then, based on the expected return of each portfolio and the index, StratiFi draws a line showing the portfolio value for each year. In the worst-case, the sequence of returns is the worst possible for the start of retirement: terrible performance in the early years, and a recovery that is often too late to save the portfolio from crashing to zero. The other shows the opposite: great returns in the early retirement years, and a bear market later.
In the demo I looked at, the proposed portfolio survived the worst-case scenario while the client’s existing portfolio did not—although it would have had the distribution been reduced to 3% a year. (Both portfolios, as you might imagine, survived the best-case sequence of returns scenario.)
What if clients might have different portfolio ‘buckets’ that are allocated to different goals? In that case, StratiFi would collect individualized risk tolerance score for each of the different portfolios, and see how they match up with the PRISM score. Advisors who practice asset location management, preferentially segmenting different types of assets into the taxable, Roth and traditional IRAs, would naturally have different PRISM scores for each portfolio, and the prospect conversation would then focus on creating an overall PRISM score for the combined assets that most closely matches the client’s risk tolerance score, even if the individual portfolios deviate.
Compliance features
Of course, advisors can do these same analyses with existing client portfolios, which basically means the advisory firm’s model portfolios. In that case, the advisory firm would pull in each client’s portfolio holdings via StratiFi’s integrations with Orion, Black Diamond and Addepar, or their custodian. If the custodial data is used, then an integration with the Redtail CRM will pull in the data needed to automatically aggregate portfolios into households, should that be desired. (In most cases, it will be.) The ByAllAccounts and Plaid integrations will allow this dashboard to include any held-away accounts and, StratiFi can include their PRISM scores into the household aggregate as well.
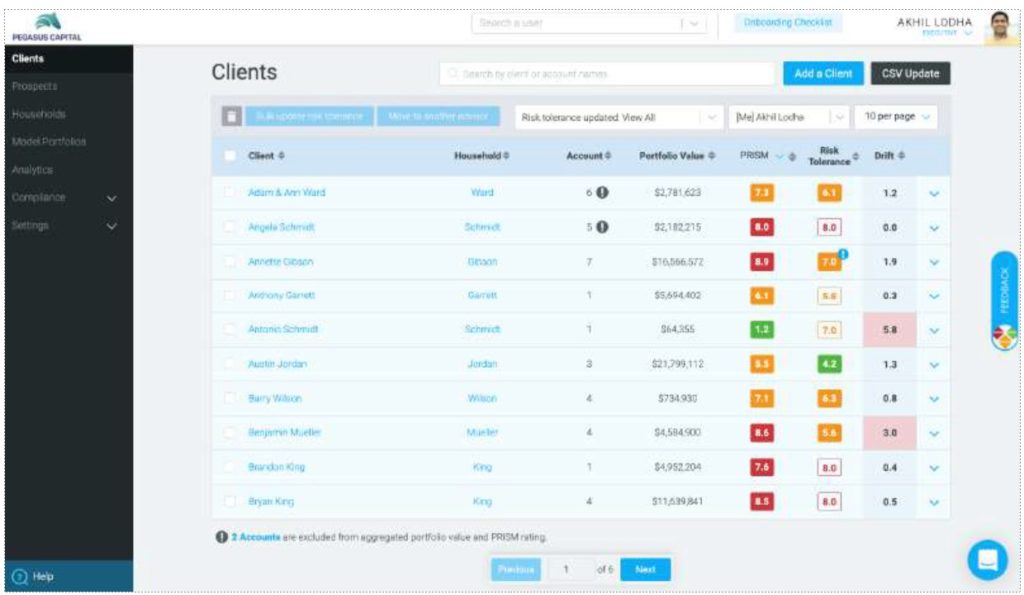
From these data feeds, StratiFi becomes a tool for monitoring, in real time, the difference between client risk tolerance scores and PRISM scores—essentially functioning as a compliance engine. Advisors can consult a dashboard which shows, in the first column, all the client names/households. Next to that: the number and types of accounts, followed by the current value of each account and overall household holdings. Move further to the right, and you can see each client’s risk tolerance score and, next column, the PRISM score of each of their portfolios and of all their household portfolios aggregated.
The final column shows what Lodha calls the ‘drift’ between each household’s risk tolerance score and the PRISM score. If a client’s risk tolerance score is 4.9 and the aggregate PRISM rating is 7.5, then the drift is an alarming 2.6—high enough to be highlighted in red, meaning that the advisor should pay attention to the disparity.
In most cases, the drift will be one or less, because the advisory firm long since normalized the risk tolerance and PRISM scores. Lodha says that larger advisory firms are using StratiFi to monitor each of their advisors’ aggregate PRISM scores (are some taking more risk than others?) and see if some are more prone to tolerating higher drifts than others. They can flag portfolios whose drift calculation puts them in the red category, and ask advisors if there’s a reason for it.
StratiFi then creates a paper trail of how the drift was addressed. Advisors can go enter a note saying they have reached out to the client to discuss the discrepancy. A second action, recorded in StratiFi might be a note that the client was invited to retake the risk tolerance instrument. Then it might record the results of a client meeting, where the advisor would either get approval from the client to leave the situation as is (perhaps due to tax sensitivity) or make changes in the portfolio to reduce the drift. For compliance purposes, the advisory firm can export all of these drift-addressing activities out to a spreadsheet, which lists the clients, the drift amounts, the actions taken, the resolved drift amounts or exceptions made and so forth.
Every note in the system is time-stamped. This output, Lodha says, has been handy when clients are undergoing state or SEC inspections.
Building portfolios
The risk attribution features built into StratiFi make it possible for advisory firms to modify their model portfolios to attain a better mix of upside and downside capture. “Let’s say I want to reduce a portfolio’s PRISM score from 8.7 to 6.0,” says Lodha. “I can look at the attribution analysis, and see which of the components of the portfolio are contributing to the overall risk, and change the allocations.” Alternatively, the advisory firm could add other assets to the portfolio, and see, in real time, their contribution to the overall risk “budget” and their impact on the PRISM score.
The other tools also factor into this portfolio building process. In the example I looked at, two portfolios had identical PRISM scores, but one of them was allocated 36% to cash. The cash-weighted portfolio showed up terribly in the retirement distribution graphs, and exhibited subpar upside capture across all the different analyses. By redeploying the cash, an advisory firm can show a client how to maintain the same PRISM risk score while dramatically improving the upside capture. In another case, a portfolio with a high correlation to equities was redeployed so that its downside capture was greatly reduced with little impact on upside capture.
StratiFi calculates each portfolio component’s contribution to its overall volatility, making it easy to change model portfolios to lower their risk score.
Bob Veres
Client reports
All of these analyses can be automatically ported into a client proposal PDF, which shows a prospect’s risk tolerance score, the PRISM score of the client’s existing portfolio vs. the proposed one, and side-by-side graphic comparisons of tail risk, upside and downside capture, the current and proposed asset allocation, a mountain chart of the current and proposed portfolio returns compared with a benchmark (which can be customized as to time period), historical returns, those hypothetical retirement drawdown graphs in best- and worst-case scenarios, and an expense analysis that shows the holding-by-holding and aggregate expense ratio of the two portfolios, in percentage and dollar terms. There’s a signature line at the end of the proposal document for compliance purposes, and advisors can add anything else they want to include, including, perhaps, their advisory agreement.
StratiFi will also generate a template investment policy statement, pulling in client portfolio data, and this, too, can be customized. In fact, advisors can create multiple templates for different types of accounts—taxable, Roth or trust accounts. They can edit the titles of each section, the summary, goals for each portfolio, and the template will automatically include the current allocations and tolerances.
Finally, StratiFi, out of the box, comes with a Form CRS template that meets the SEC’s regulations, which advisors can customize. Of course each of these PDF templates—the proposal, the IPS and the Form CRS, are white labeled to the firm, with the firm logo, firm name and (if desired) the lead advisor on the cover page.
Lodha concedes that a typical prospect meeting, or portfolio meeting with clients, will leave out some of these analyses. Advisors can include as much or as little as they want when they engage in prospect presentations or build the proposal PDF. But he does seem to have achieved the goal of creating institutional-level risk analysis, and the fact that all of the millions of daily calculations are brought together in such a straightforward interface is impressive. Indeed, one can imagine a Goldman risk analyst using StratiFi, although he might complain that the interface doesn’t look nearly complicated enough. If the goal is to impress clients by visibly demonstrating a professional approach to building and managing portfolios, there is not a better tool on the market.
More than that, I think having a side-by-side comparison tool that constantly monitors the spread between client risk tolerance and the portfolio risk score can be extremely handy during volatile markets. As StratiFi pulls in daily market feeds and conducts millions of behind-the-scenes calculations about the shifting valuations, migrating correlations and so forth, we may experience situations—sooner rather than later—when client risk preferences shift lower at a time when their PRISM scores are rising. Monitoring those numbers in real time on a dashboard could result in better client conversations.
Advisory firms can access StratiFi for free during a 14 day trial; after that, the cost for the best combination of features is $299 per advisor in the office per month. That buys the ability to use StratiFi with an unlimited number of clients and prospects, plus the compliance features, templates, integrations and white labeling. (There’s an enterprise pricing structure that includes customizations, which might be more appropriate for broker-dealers and firms with dozens of advisors across many different offices.)
If you have a free moment, check out what it would feel like to be one of those quants who monitor billions of dollars worth of daily trades at a brokerage desk—or simply an advisor who wants to help clients keep their portfolios within their comfort zone.